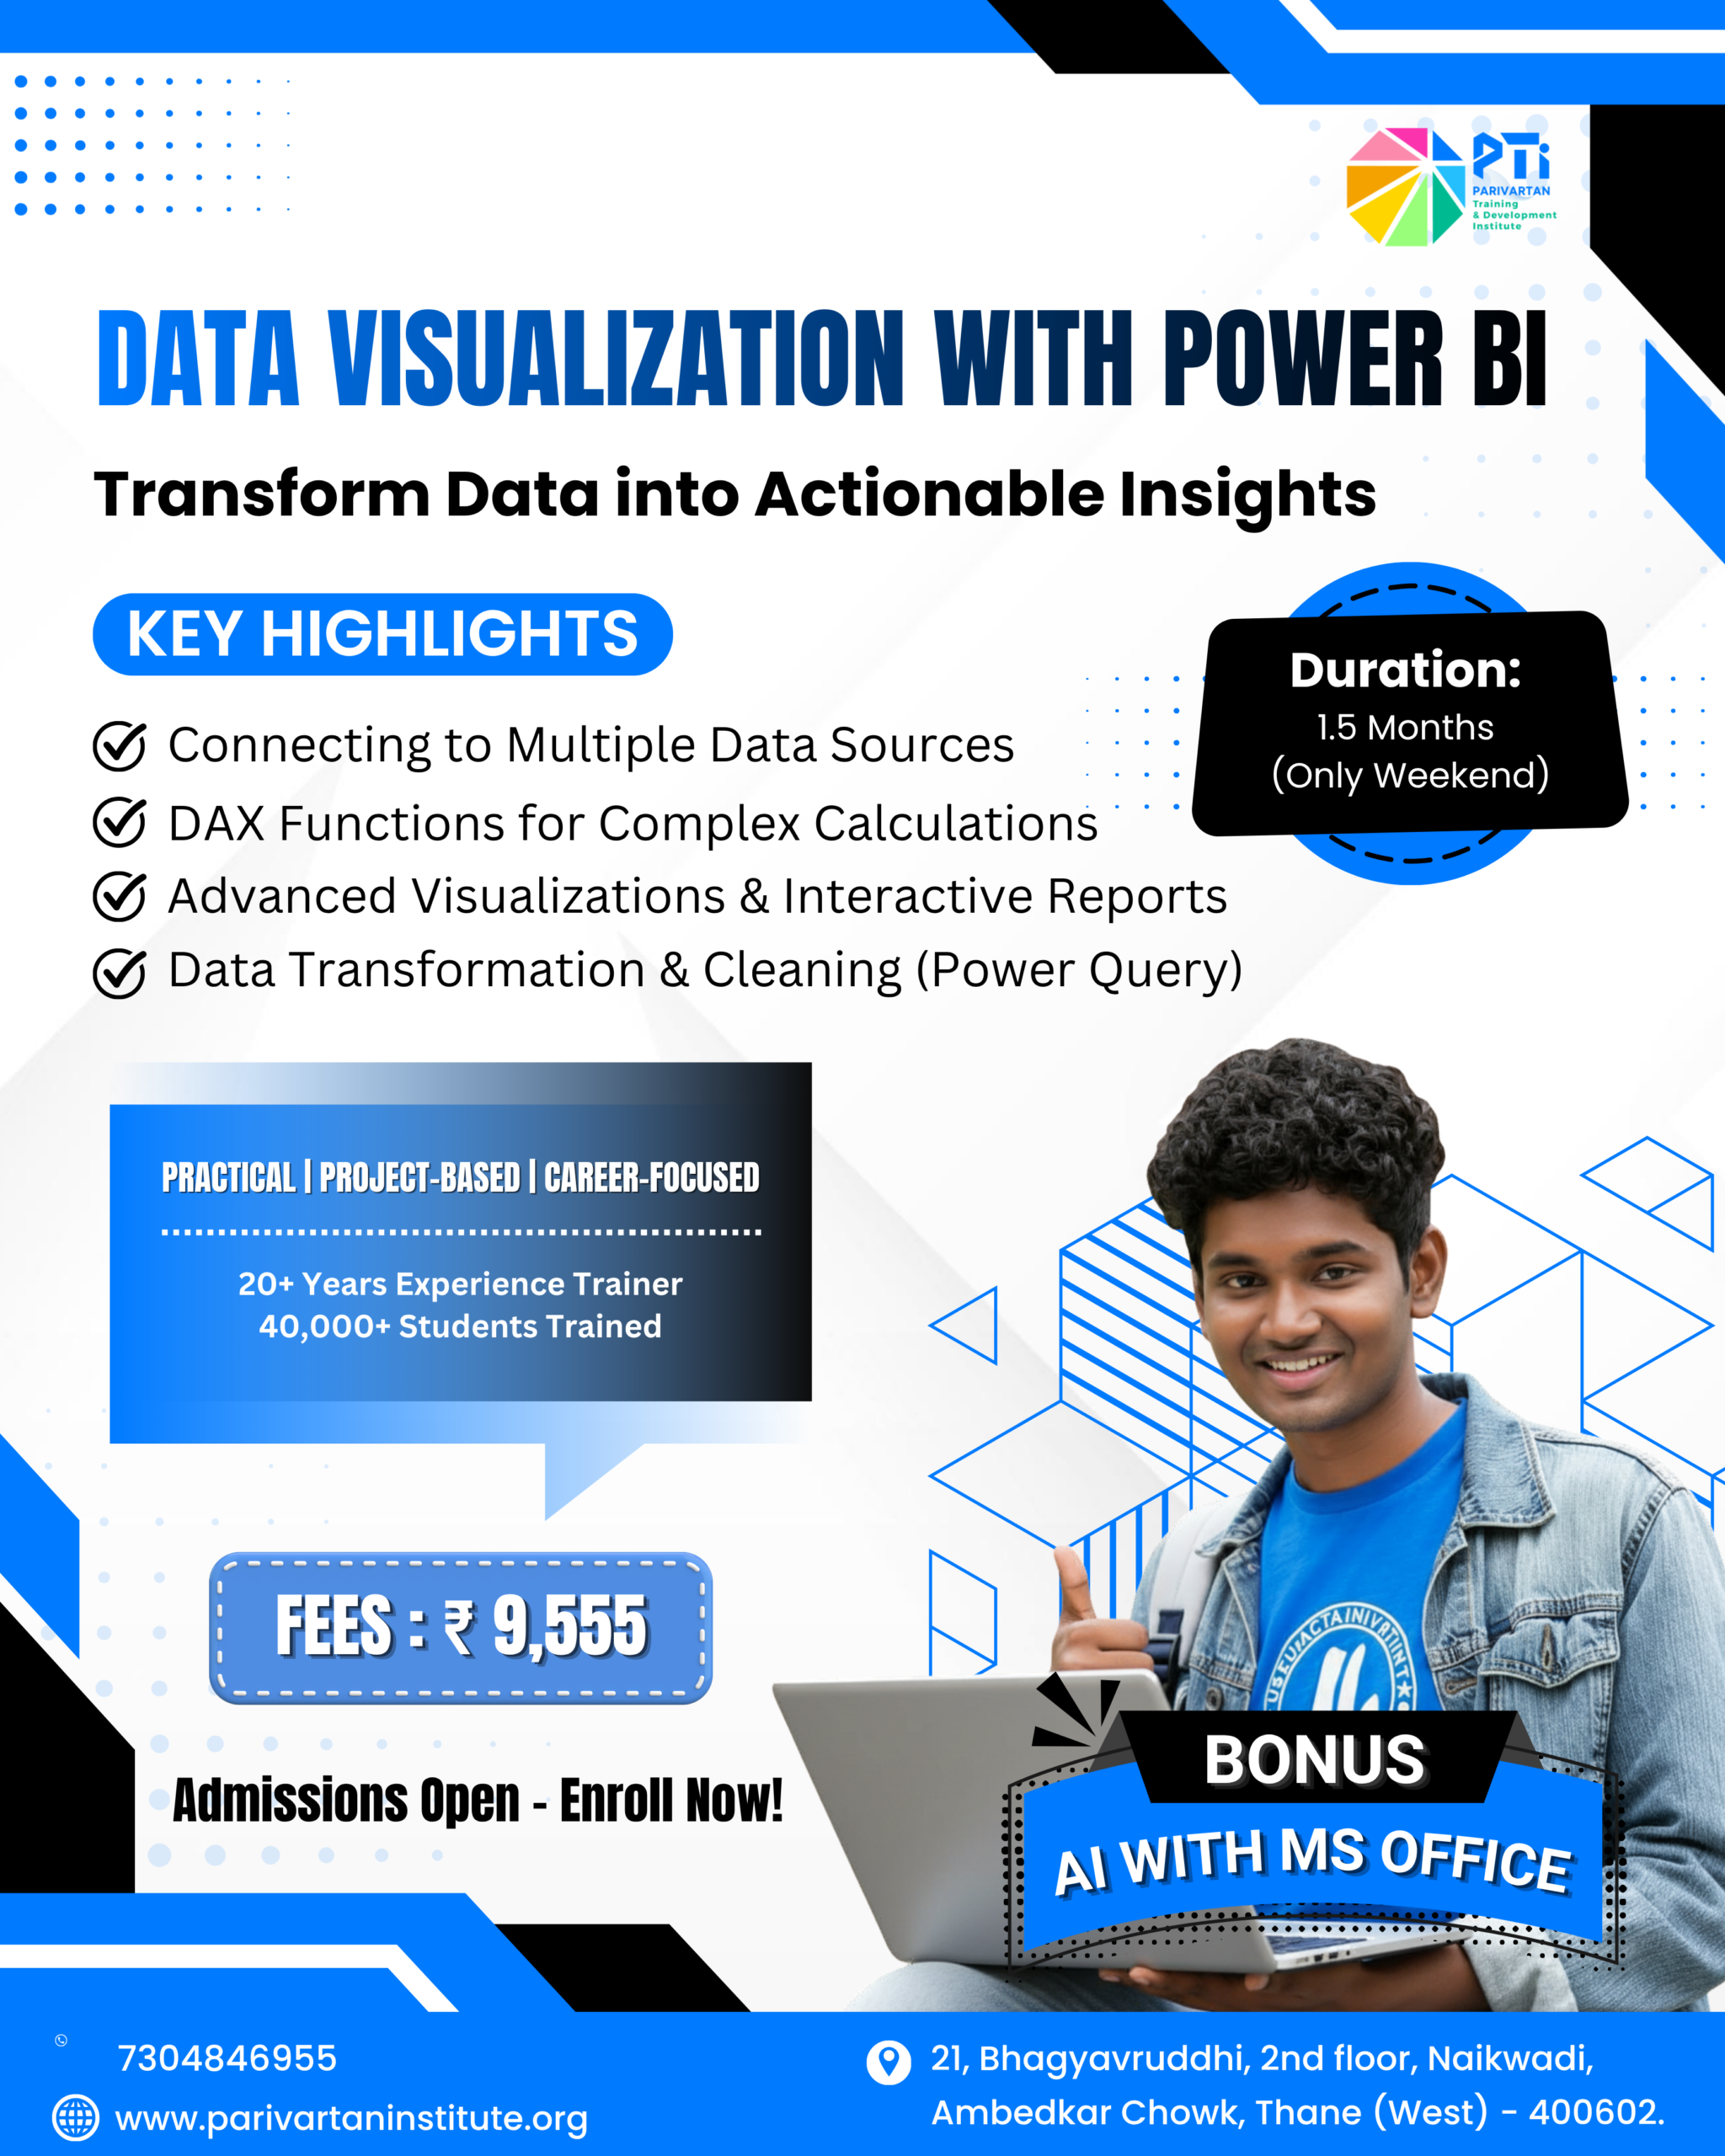

Data Visualization with Power BI
Duration – 1.5 Months, Only Weekend batches
Eligibility:
-
- Students: Students: B.Com, BBA, MBA, B.Sc (IT/CS/Statistics), BCA, MCA, Engineering, or Diploma backgrounds
- Working Professionals: MIS Executives, Accountants, Business Analysts, Sales & Marketing professionals, HR professionals, IT professionals, and anyone working with data and reports.
Key Features
- Learn from Industry Mentors
- Career Support at Every Step
- Government-Approved Course
- Career Readiness Programs
Course Objective
The course is provided with a basic understanding and concept of using Power BI , and hands-on exercises covering most of course content and some will be an overview, and providing the opportunity to visually analyse data, build Interactive Dashboards and share them with others.
Key Features
- Expert-Led Training: Curriculum delivered by a senior consultant with 20+ years of domain authority.
- Scale & Reliability: A trusted institute with a massive footprint of 40,000+ trained professionals.
- End-to-End Placement Assistance: Comprehensive support to bridge the gap between learning and employment.
- Corporate Readiness: Includes specialized Personal Development sessions to ensure you are “Day 1” ready.
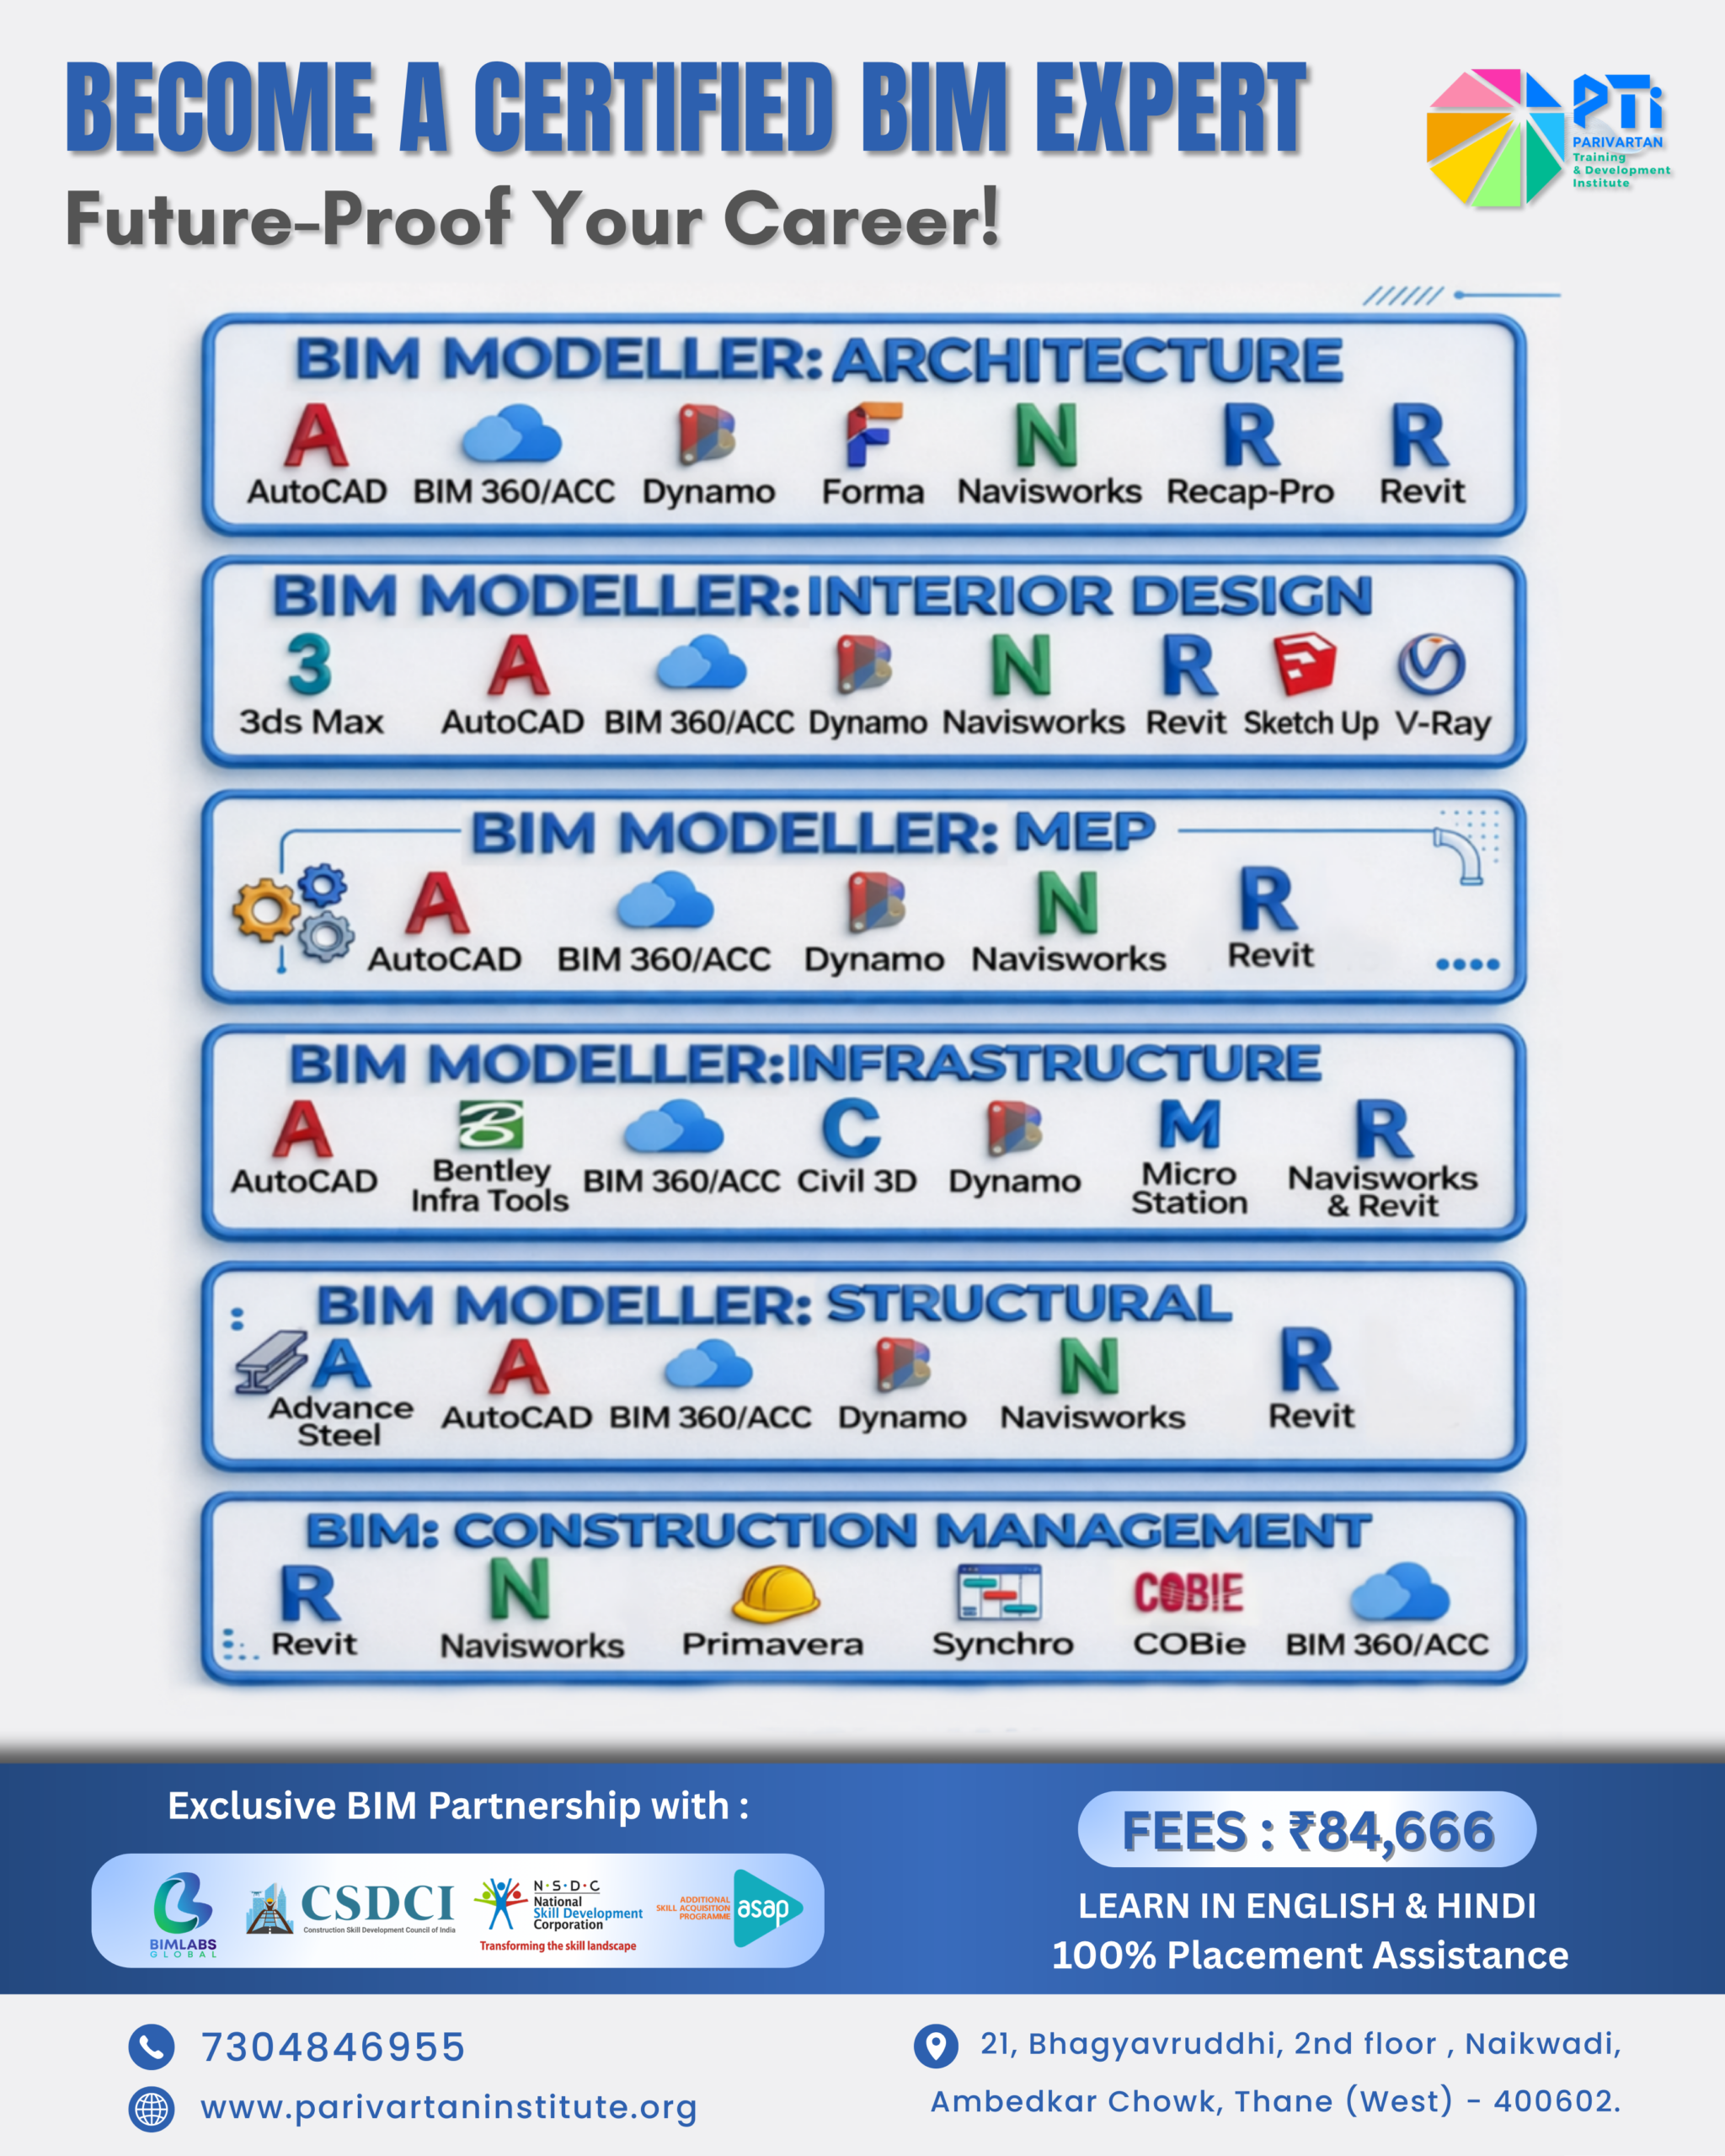
Course Content
- Introduction to BI Solutions and understanding Microsoft Excel for creating dashboards
- Understanding Microsoft Power BI to generate various reports and basic dashboards
- Transforming data using Power BI
- Working with complex report views to visualize data
- Working with different data visualizations
- Creating reports for dashboards
- Sharing your work in Power BI
Job Opportunities
- Power BI Developer
- Data Analyst
- Business Intelligence Analyst
- MIS Executive
- Reporting Analyst
- Business Analyst